Atmospheric boundary layer turbulence decay and its budget in the afternoon transition
To understand near-surface turbulence decay better in the afternoon transition period we use field measurements from the Boundary Layer Late Afternoon and Sunset Turbulence (BLLAST) field campaign that took place in June and July 2011 in southern France.
We use high frequency measurements to craft a turbulence kinetic energy (TKE) budget for all 10 Intensive Observation Period days with surface layer measurements (2 to 8 m) at a small tower. Diversity with regard to the amount of shear production is found among the different days of the field campaign leading also to diversity in transport of TKE with the surroundings. Differences in wind and dissipation rate among different days are furthermore investigated by analysis of surface and boundary layer observations from UHF, radio soundings and tower measurements. We will show improvement in modelling of near-surface dissipation rates by taking into account of both measurement height and boundary layer height.
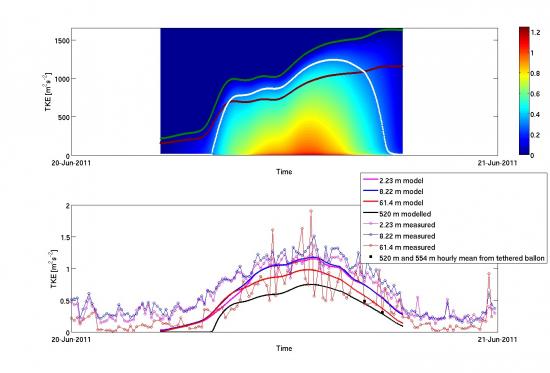
The observed TKE decay in the boundary layer is furthermore compared to results from a simple convective boundary layer TKE model developed based on the BLLAST observations. We will show that a relatively good prediction of TKE can be achieved if friction velocity, near-surface wind gradient, buoyancy production and boundary layer height attains reasonable values compared to the observed. This indicates that these variables are of primary importance for an accurate prediction of TKE.
We will also discuss first comparisons between observations and a meso-scale model AROME, which underestimate near-surface TKE when the near-surface winds are well modelled.

In the upper figure the turbulence kinetic energy output from a simple TKE model is plotted for June 20. A red line is included to indicate the observed boundary layer height from smoothed lidar measurements. The green line is indicating where turbulence is 0 and the white line when TKE is lower than a value of 0.3 m2s-2. In the lower figure the modelled TKE (thick lines) are compared to observed 10 min values of TKE at 3 measurement levels (thin lines with circles) and tethered balloon measurements (black squares).


